Kubernetes powers modern containerized applications, but managing its storage volumes—such as Persistent Volumes (PVs), Persistent Volume Claims (PVCs), and underlying storage backends (e.g., AWS EBS, Ceph, NFS)—is a complex task. Kubernetes storage monitoring through observability provides a unified view of storage performance, capacity, and health, enabling teams to prevent outages, optimize resources, and ensure application reliability. This guide explores the critical role of observability in Kubernetes storage monitoring, identifies key challenges, and outlines seven comprehensive strategies to achieve centralized visibility into storage volumes using tools like Grafana, Prometheus, and Loki.
Understanding Kubernetes Storage Monitoring
Kubernetes storage monitoring involves collecting, analyzing, and visualizing metrics, logs, and traces to gain actionable insights into the performance, capacity, and health of storage volumes in Kubernetes clusters. Storage volumes are essential for stateful applications, such as databases or content management systems, and include PVs, PVCs, and storage backends. Observability enables teams to:
- Monitor storage performance metrics (e.g., IOPS, latency, throughput).
- Track capacity usage to avoid over-provisioning or exhaustion.
- Detect anomalies (e.g., volume failures, misconfigurations).
- Correlate storage health with application and cluster performance.
Without robust monitoring, organizations face risks like:
- Application Downtime: Unaddressed volume failures disrupt critical services.
- Cost Overruns: Over-provisioned storage inflates cloud costs.
- Performance Degradation: I/O bottlenecks or high latency impair user experience.
- Security Vulnerabilities: Misconfigured storage may expose sensitive data.
A 2024 outage at a fintech company, caused by undetected storage volume saturation, illustrates the need for observability. Learn more about Kubernetes storage concepts in the Kubernetes documentation.
Challenges in Kubernetes Storage Monitoring
Achieving effective Kubernetes volume observability is challenging due to:
- Distributed Storage Systems: Volumes span multiple nodes, pods, and storage providers, complicating unified monitoring.
- Heterogeneous Backends: Diverse storage types (e.g., local disks, cloud storage, distributed file systems) require tailored metrics.
- Fragmented Data Sources: Metrics, logs, and events are scattered across Kubernetes components and storage drivers.
- Dynamic Nature: Ephemeral containers and dynamic provisioning demand real-time, scalable monitoring.
- Tool Configuration Complexity: Setting up observability for storage requires expertise in tools like Prometheus and Grafana.
- Security Concerns: Storage misconfigurations may lead to unauthorized access, requiring integrated security monitoring.
7 Strategies for Kubernetes Storage Monitoring
To achieve comprehensive Kubernetes storage monitoring, implement these seven strategies leveraging observability tools.
1. Centralize Storage Metrics for Kubernetes Volume Observability
Unified observability begins with aggregating storage metrics in a single platform. Tools like Prometheus and Grafana enable:
- Scraping metrics from Kubernetes components (e.g., kubelet, Container Storage Interface (CSI) drivers).
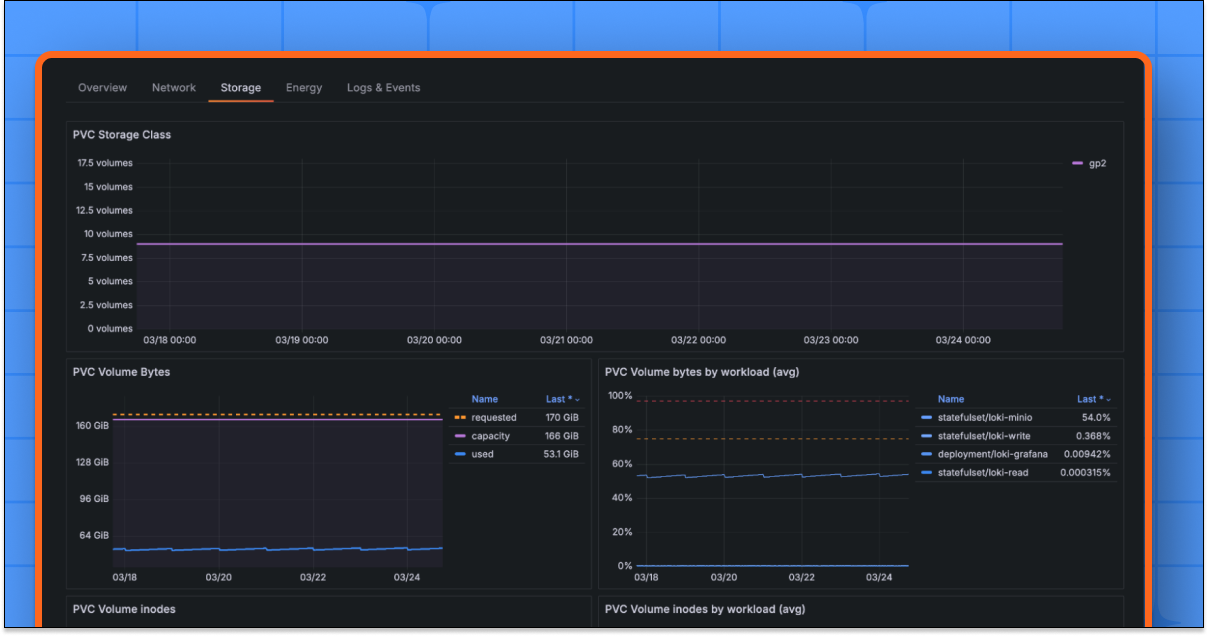
- Visualizing storage performance (e.g., IOPS, latency) and capacity (e.g., used vs. available space).
- Correlating storage metrics with pod, node, and application health.
Example Prometheus Query:
promql
sum(rate(container_fs_io_time_seconds_total{namespace=~"prod.*"}[5m])) by (namespace, pod)Action: Deploy Prometheus with the Prometheus Operator and integrate it with Grafana. Configure CSI driver exporters to scrape storage metrics. Use Grafana’s Kubernetes Monitoring for pre-built storage dashboards.
2. Track Storage Capacity in Real Time
Capacity exhaustion can cause application failures or data loss. Observability tools monitor:
- PVC usage (e.g., kube_persistentvolumeclaim_info).
- PV availability and allocation trends.
- Alerts for nearing capacity thresholds (e.g., 85% full).
Example Grafana Dashboard Panel:
- Query: sum(kube_persistentvolumeclaim_info) by (namespace, persistentvolumeclaim)
- Visualization: Bar gauge showing PVC usage per namespace.
Action: Set up Grafana dashboards to visualize capacity metrics and configure alerts for high usage. Ensure storage classes support dynamic provisioning to scale capacity.
3. Analyze Storage Performance for Optimal Kubernetes Monitoring
Storage performance issues, such as high latency or low IOPS, can degrade application performance. Observability enables:
- Monitoring read/write latency and throughput (e.g., container_fs_reads_total).
- Identifying bottlenecks in storage backends (e.g., slow cloud disks).
- Correlating performance with workload demands.
Example Prometheus Query:
promql
rate(container_fs_write_time_seconds_total[5m]) > 0.05Action: Use Prometheus to query performance metrics and create Grafana visualizations for IOPS and latency. Set thresholds for performance degradation alerts.
4. Aggregate and Analyze Storage Logs with Loki
Logs from storage components (e.g., CSI drivers, storage backends) provide insights into errors, failures, or misconfigurations. Grafana Loki supports:
- Aggregating logs from Kubernetes storage components.
- Correlating logs with metrics for root cause analysis.
- Querying logs with LogQL for troubleshooting (e.g., volume mount errors).
Example LogQL Query:
logql
{namespace="kube-system", component="csi-driver"} |~ "error|failed"Action: Deploy Loki to collect storage-related logs and integrate with Grafana for unified metric-log visualization. Refer to Loki’s documentation for setup guides.
5. Configure Alerts for Proactive Kubernetes Storage Monitoring
Proactive monitoring requires alerts for critical storage events, such as:
- Volume failures or detachments (e.g., kube_persistentvolume_status_phase{phase=”Failed”}).
- Capacity thresholds (e.g., 90% full).
- Performance issues (e.g., I/O wait times exceeding 100ms).
Example Prometheus Alert Rule:
yaml
groups:
- name: storage-alerts
  rules:
  - alert: HighVolumeUsage
    expr: kube_persistentvolumeclaim_info > 0.9
    for: 5m
    labels:
      severity: critical
    annotations:
      summary: "PVC {{ $labels.persistentvolumeclaim }} in namespace {{ $labels.namespace }} nearing capacity"
      description: "Storage usage exceeds 90%. Consider scaling or cleanup."
Action: Configure Prometheus Alertmanager with Grafana for storage alerts, ensuring notifications via Slack or email.
6. Correlate Storage with Cluster and Application Data
Storage issues often impact applications and clusters. Observability tools like Grafana enable:
- Correlating storage metrics (e.g., latency) with pod CPU/memory usage.
- Tracing application performance issues to storage bottlenecks.
- Analyzing cluster-wide impacts (e.g., node failures affecting volumes).
Action: Use OpenTelemetry for distributed tracing and integrate with Grafana to correlate storage, application, and cluster data. Create dashboards linking PVC metrics to pod health.
7. Automate Storage Monitoring in DevSecOps Pipelines
Embedding Kubernetes storage monitoring in DevSecOps workflows ensures continuous visibility and security. Observability supports:
- Automated validation of storage configurations in CI/CD with Checkov.
- Real-time dashboards for DevOps and storage teams.
- Integration with Infrastructure as Code (IaC) tools like Terraform for consistent storage provisioning.
Example Terraform Snippet:
hcl
resource "kubernetes_persistent_volume" "example" {
  metadata {
    name = "example-pv"
  }
  spec {
    capacity = {
      storage = "10Gi"
    }
    access_modes = ["ReadWriteOnce"]
    persistent_volume_source {
      host_path {
        path = "/mnt/data"
      }
    }
  }
}
Action: Integrate Prometheus and Grafana into CI/CD pipelines (e.g., GitHub Actions) and train teams via CNCF’s Kubernetes Training.
Case Study: The Cost of Inadequate Kubernetes Storage Monitoring
In 2024, a healthcare SaaS provider experienced a 4-hour outage when a Persistent Volume reached 100% capacity, disrupting patient data access and costing $2 million in downtime and penalties. The issue stemmed from undetected capacity growth in a MySQL database PVC, exacerbated by fragmented monitoring. Post-incident, the provider implemented Grafana and Prometheus, achieving:
- Unified dashboards showing PVC capacity (e.g., kube_persistentvolumeclaim_info).
- Alerts for 85% capacity thresholds, sent via Slack.
- Log analysis with Loki to identify CSI driver errors.
- Correlation of storage metrics with application latency, reducing mean time to resolution (MTTR) by 40%.
This case highlights the critical need for Kubernetes storage monitoring to ensure reliability and compliance.
Best Practices for Sustaining Kubernetes Storage Monitoring
To maintain robust Kubernetes volume observability:
- Consolidate Tools: Use Grafana as a single pane of glass for metrics, logs, and traces.
- Optimize Collection: Enable metric sampling to reduce cluster overhead.
- Enhance Security: Monitor storage for misconfigurations (e.g., overly permissive access) using Kube-bench.
- Audit Dashboards: Review Grafana dashboards quarterly to ensure relevance.
- Scale Monitoring: Use Thanos for long-term Prometheus metric storage in large clusters.
- Train Teams: Educate on storage monitoring via Kubernetes Storage SIG.
Tool Comparison: Kubernetes Storage Monitoring Solutions
| Tool | Purpose | Strengths | Weaknesses | Best For |
|---|---|---|---|---|
| Grafana | Visualization, dashboards | Customizable, integrates metrics/logs | Requires setup expertise | Unified observability |
| Prometheus | Metrics collection | Kubernetes-native, scalable | Short-term storage by default | Performance and capacity |
| Loki | Log aggregation | Lightweight, Grafana integration | Limited to logs, not traces | Log-based troubleshooting |
| OpenTelemetry | Traces and metrics | Standardized, cross-platform | Complex for beginners | End-to-end observability |
Conclusion
Kubernetes storage monitoring is vital for ensuring the reliability, performance, and security of stateful applications in Kubernetes clusters. Observability tools like Grafana, Prometheus, and Loki provide a unified view of storage volumes, enabling teams to monitor capacity, performance, and health proactively. By centralizing metrics, analyzing logs, setting alerts, and automating monitoring, organizations can achieve Kubernetes volume observability that supports DevSecOps and operational excellence.
Take action: Download our free Kubernetes Monitoring Checklist or contact us for a demo of our observability platform to optimize Kubernetes storage monitoring.